QUARCC Purple: A Market-Neutral US Equity Fund for the McGill-FIAM 2026 Final
How the QUARCC Purple team built a simulated $1 billion market-neutral fund: encompassing LASSO forecasts, a semivariance risk model, and relax-and-round construction, and why it still trails its T-bill-plus-4% benchmark.
QUARCC Purple is a simulated $1 billion US equity fund built for the final round of the McGill-FIAM Asset Management Hackathon 2026. The mandate is market-neutral and the benchmark is the 3-month T-bill plus 4% a year.
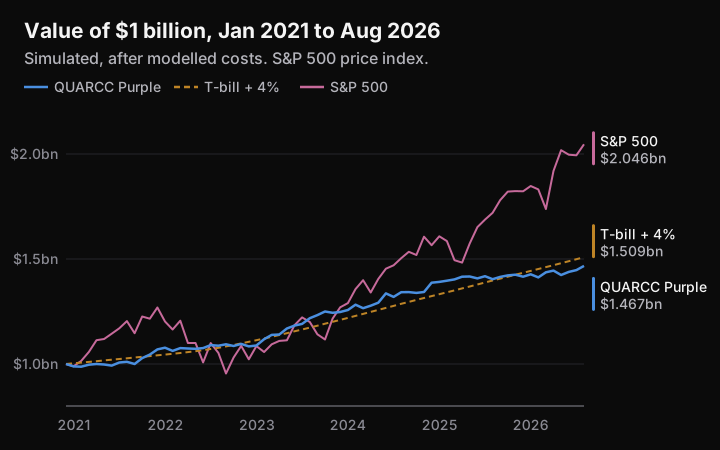
From January 2021 to August 2026, after modelled costs, the fund grows to $1.467 billion: a 7.00% CAGR with 3.96% volatility, a Sharpe ratio of 0.91, a maximum drawdown of −2.99%, and an S&P 500 beta of 0.012. It does not beat its benchmark. The information ratio is −0.11 with a standard error of 0.42.
The code is public in the QuarccPurple repository. There is also a fact sheet, a project site, and a paper (PDF) with the full method and references.
Mandate
The fund must hold 200 to 500 names, with gross exposure of at most 200%, net exposure within ±50%, a 5% single-name limit, sector net exposure within ±20%, and no short below a $500 million market capitalisation. We add tighter limits of our own, including a $3 billion floor on new positions.
Forecasting
Encompassing LASSO. The forecaster follows Han, He, Rapach, and Zhou (2019). Each month it fits a value-weighted LASSO on all predictors jointly and a second LASSO that selects among univariate forecasts. A Chong and Hendry (1986) encompassing regression then sets the weight between them:
The target is the centred cross-sectional rank of each stock’s CAPM beta-adjusted return, so the model is not rewarded for simply loading on high-beta tails.
Anomaly augmentation. To the 147 characteristics of Jensen, Kelly, and Pedersen (2023), we add three signals:
- A mispricing composite after Stambaugh, Yu, and Yuan (2012), averaging signed ranks of ten anomalies available in the panel.
- A walk-forward LightGBM forecast of next-quarter earnings surprises.
- Short interest, used only once its settlement date is public.
The US Long-Short Portfolio takes a different route through the same panel. It finds that forecast skill sits heavily in small-capitalisation shorts, which this mandate largely excludes, and that contrast is worth reading alongside this fund.
Market-state dial. A grid of correlation regime and trailing HML sign scales forecasts by how well the model has done in similar states, shrunk toward its overall record with :
At each mid-month formation, nine price signals are refreshed using the latest 21 days of returns, with coefficients held fixed.
Risk
The covariance combines a market factor, 11 GICS sectors, five styles, and five residual principal components. Factor covariance is extended to the holding horizon with lagged autocovariances:
Specific risk comes from a QLIKE race (Patton, 2011) between HAR and EWMA forecasts, split into downside and upside semivariances. Longs are charged downside variance and shorts upside variance. A two-state Markov stress probability then mixes in a stressed factor matrix.
Construction
A book is formed at each month-end and mid-month, 136 in all, and is traded in equal fifths over five sessions with a 10% daily volume limit. The final program trades expected return against risk, beta, borrow, costs, and low feature coverage:
with and . To meet the name limit and a 10 bp minimum position, we solve the relaxation, keep at most 440 names, lock their signs, and re-solve with Clarabel through CVXPY. Beta is limited on three separate estimators, and sector net is held within ±1%, far tighter than the mandate requires.
Eight local language-model agents read filings, draft commentary, measure crowding, and challenge the book. None of them sets a weight.
Results
| Metric | QUARCC Purple | T-bill + 4% | S&P 500 |
|---|---|---|---|
| Ending value of $1.000bn | $1.467bn | $1.509bn | $2.046bn |
| CAGR | 7.00% | 7.53% | 13.47% |
| Volatility | 3.96% | 15.10% | |
| Sharpe ratio | 0.91 | 0.70 | |
| Sortino ratio | 4.21 | 1.51 | |
| Maximum drawdown | −2.99% | −25.43% | |
| Beta to the S&P 500 | 0.012 | 1.00 | |
| Information ratio vs. T-bill + 4% | −0.11 |
| Year | Fund | T-bill + 4% |
|---|---|---|
| 2021 | 6.98% | 4.12% |
| 2022 | 1.34% | 6.19% |
| 2023 | 15.10% | 9.45% |
| 2024 | 11.16% | 9.34% |
| 2025 | 2.08% | 8.37% |
| 2026 (to August) | 3.62% | 5.21% |
The book holds 246 to 357 names, with gross exposure averaging 136.5%, and breaches no mandate limit. Of the $467 million net profit, stock positions contribute $258 million, cash interest $240 million, and costs take $30 million. Interest is nearly half of gross profit, which is why the T-bill-based hurdle is the fair comparison.
Limitations
- Benchmark shortfall. The fund trails its hurdle by 53 bps a year, and costs equal 72% of the cumulative shortfall. The information ratio before costs is about zero. A standard error of 0.42 cannot separate a modest edge from none.
- Selection. Forecasts are walk-forward, but construction settings, including the final gross scale, were chosen with 2021 to 2026 visible, so the sample is not a clean holdout.
- Time variation. The fund trailed the hurdle in 2022, 2025, and 2026 to date. Gross averaged 136.5%, well below the 200% limit.
- Simulated execution. No order was placed. Fills, borrow, and impact at $1 billion may differ. Our paper-fund page marks a single frozen 24 August 2026 formation forward with market data. It is not a live record.
Read more
More From The Archive
- Nov 2, 2026Causal Macro-Financial Stress Indices, Cross-Sectional Stress Betas, and Regime Conditioning in quarcc-risk-regime
- Nov 2, 2026Fast Portfolio Optimisation: Interior-Point Methods That Keep the Structure
- Nov 2, 2026The US Long-Short Portfolio: Tail-Weighted Forecasts and Sensitivity to Delisting Assumptions